
01
Sept
By Ahmed Tayeh · Industry Knowledge · 01 Sept 2026
How to Read a Single Line Diagram: A Complete Guide for Electricians and Engineers
In electrical engineering, few documents are as important as the Single Line Diagram (SLD). Whether you're working on a solar farm, battery energy storage system (BESS), or industrial facility, the SLD provides a high-level view of how electrical power flows throughout the system.
It’s the first document an engineer reaches for when trying to understand an electrical system, which is why the ability to read it is an essential skill. And for engineers who need to go beyond reading, understanding the structure of a well-drawn SLD is the starting point.
This guide covers the complete framework for reading, interpreting, and applying single line diagrams on real engineering projects.
What Is a Single Line Diagram?
A Single Line Diagram is a high-level schematic diagram showing how incoming power is distributed to equipment. It’s a simplified representation using a single line to represent a three-single-phase power circuit rather than showing every conductor and connection.
The purpose of an SLD is to provide a clear overview of the electrical network without overwhelming the reader with unnecessary detail. It makes complex electrical systems comprehensible at a glance while preserving all essential technical information about components, ratings, and interconnections.
What would otherwise be a tangle of conductors, contacts, and connections becomes a readable, logical diagram that shows exactly how power flows and how the system is protected.
Single Line Diagram vs. Schematic Diagram
This is a common point of confusion, particularly for those new to electrical engineering.
- A Single Line Diagram shows the high-level architecture, which major components are connected, how voltage levels change, and where protection devices sit in the circuit.
- A Schematic Diagram shows the detailed electrical connections, individual conductors, relay contacts, terminal numbers, and cable references.
Both are essential documents in a complete engineering document set. The SLD is the starting point for system understanding; the schematic is the reference for detailed execution.
Why Are Single Line Diagrams Essential on Every Project?
During design, engineers use SLDs to develop system layouts, perform load calculations, and verify protection coordination. During construction, contractors reference them to understand installation requirements. Once the facility is operational, maintenance teams rely on them for troubleshooting and future modifications.
A well-prepared SLD helps stakeholders:
- Understand the overall electrical architecture
- Identify major equipment and interconnections
- Support maintenance and fault investigations
- Facilitate future upgrades and expansions
Without an accurate Single Line Diagram, understanding and managing an electrical system becomes significantly more difficult.
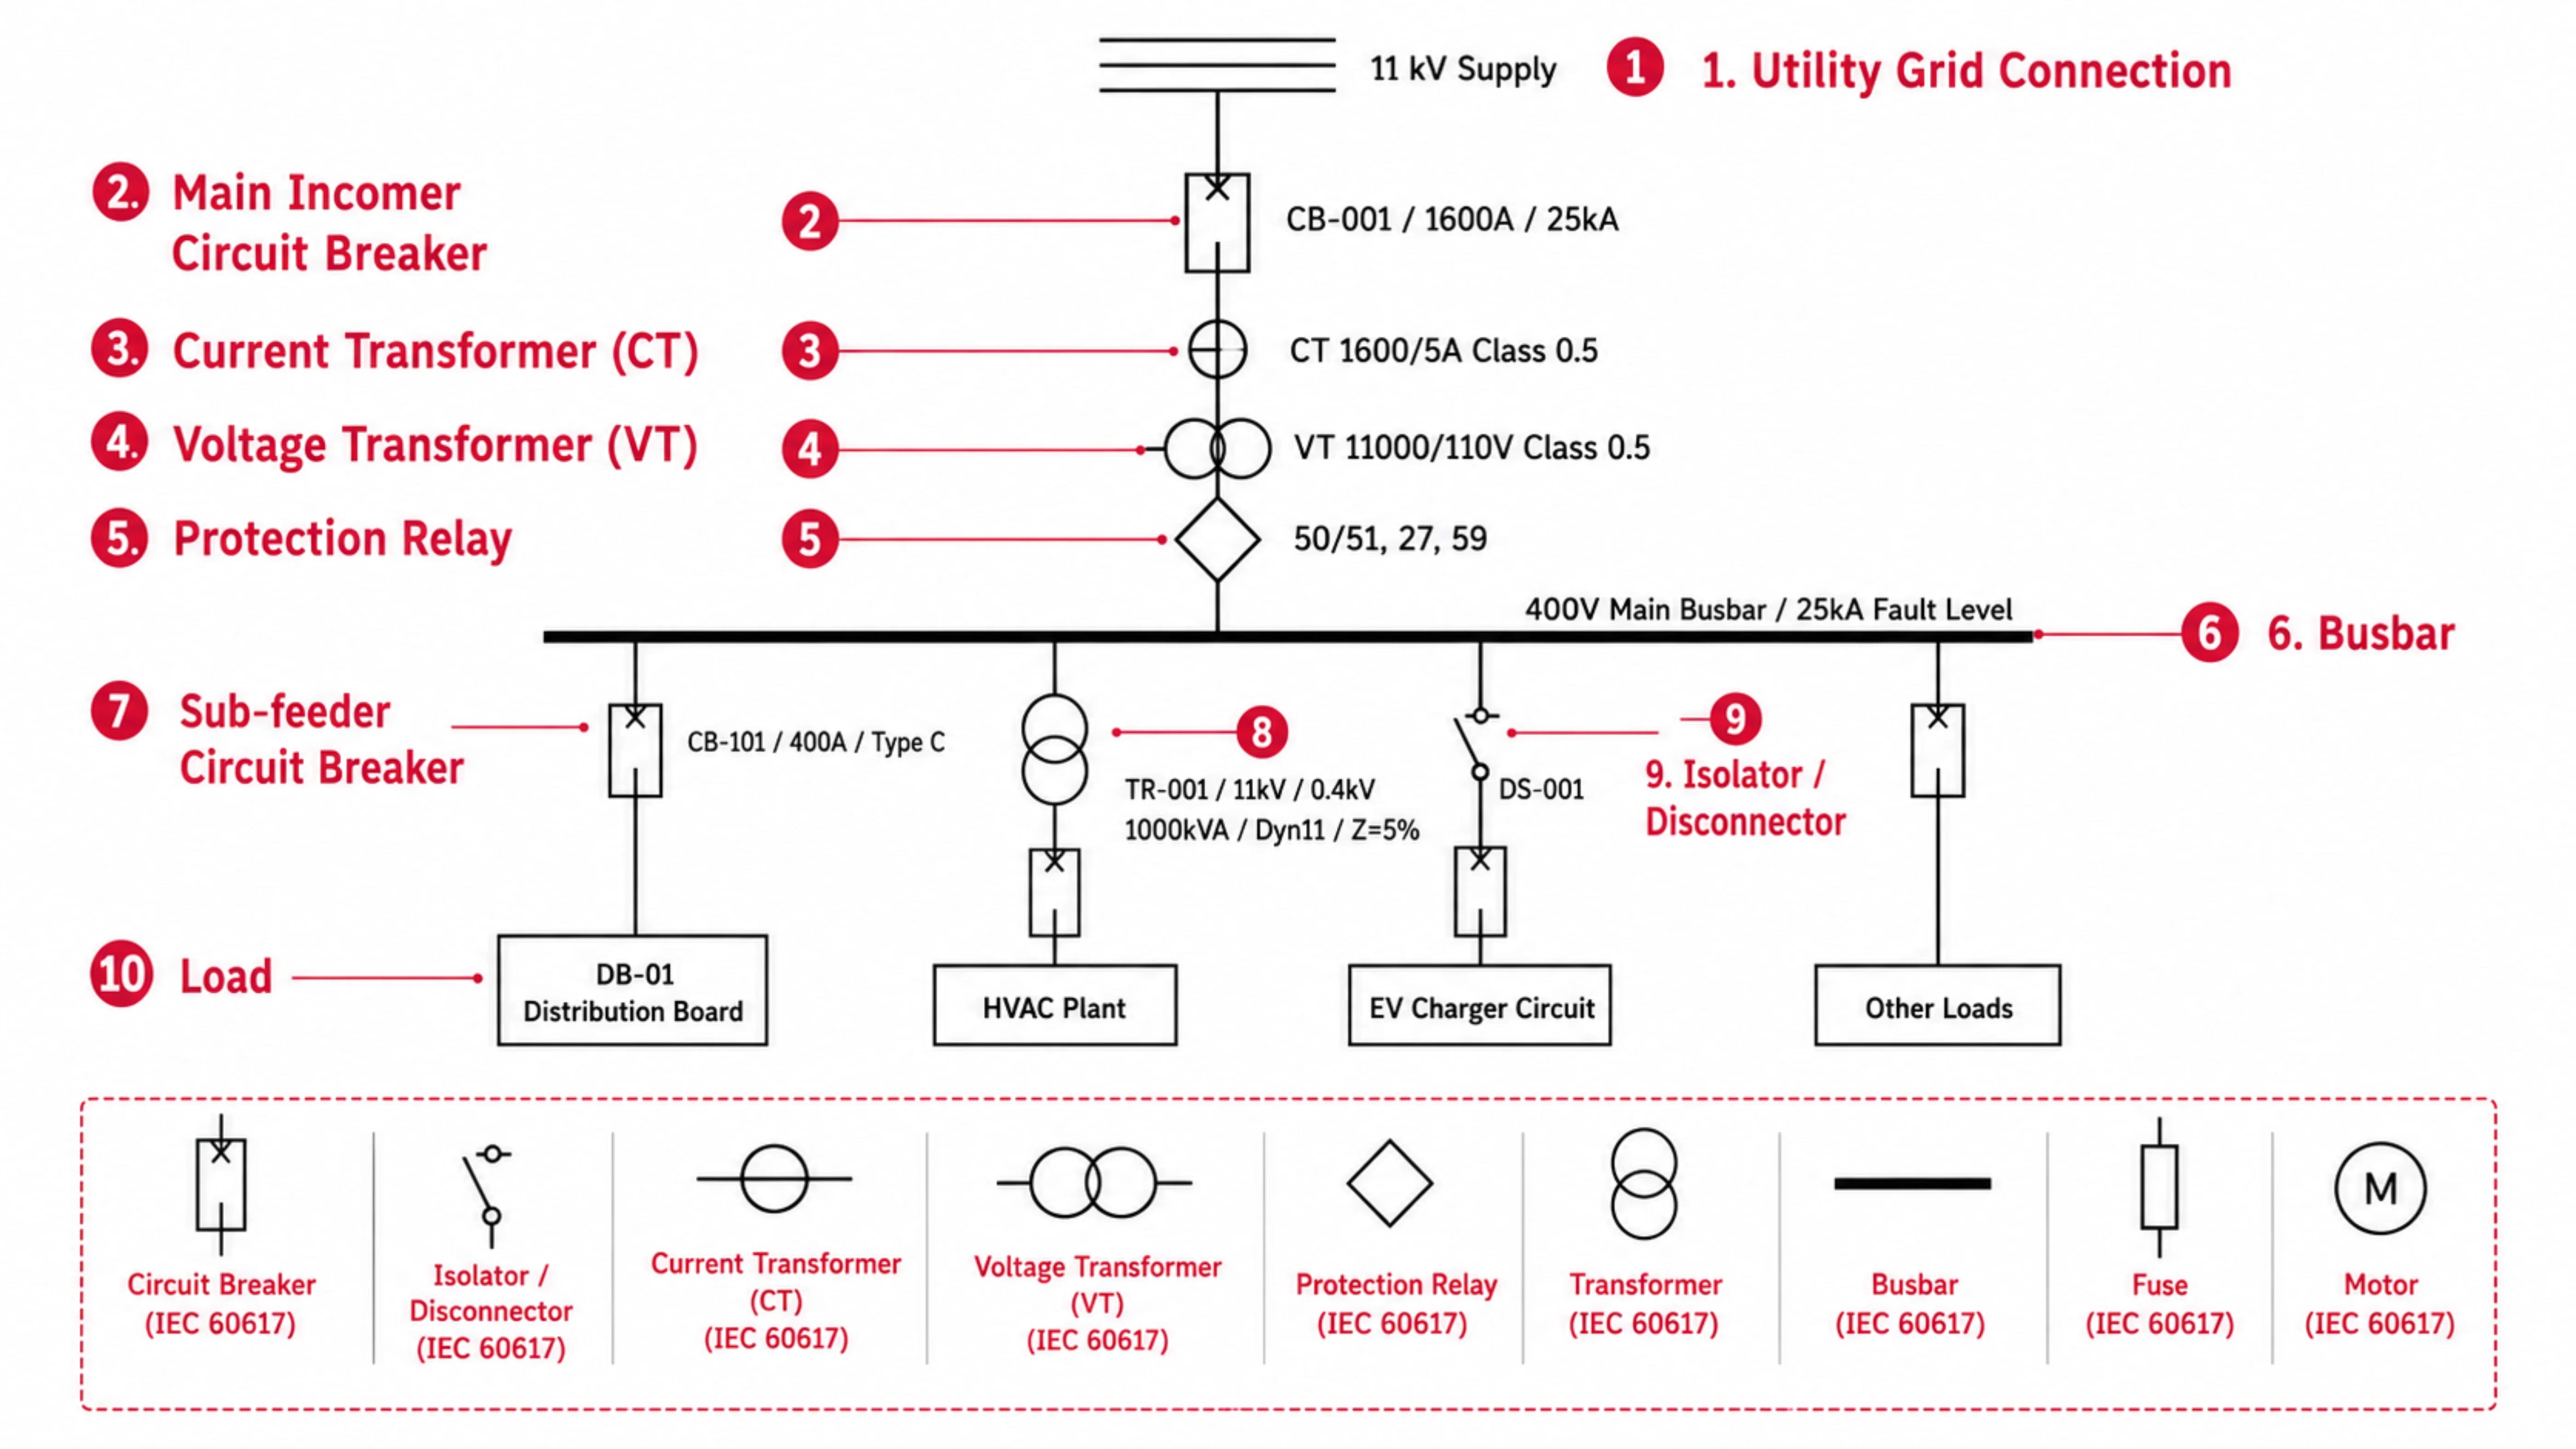
What Are the Standard Symbols Used in Single Line Diagrams
Two standards dominate electrical schematic symbols:
- IEC 60617: Used in Europe, China, Australia, Middle East, and most of Asia
- ANSI/IEEE 315: Used in North America
They overlap on many components but differ on others: transformers, motors, and protective devices have visibly different shapes.
Engineers working on Australian projects should use IEC symbols throughout their SLDs. ANSI symbols appear frequently on imported equipment documentation and vendor-supplied drawings. Being able to recognise both standards is a practical advantage, even if only IEC symbols are used in Australian project documents.
Power Sources and Generation
- Utility Grid Connection: Typically shown as three horizontal lines of decreasing length (representing the three-phase supply) at the top of the diagram, or as a standard transformer connection to the transmission network.
- Solar PV Array: Represented by a series of cells or by a labelled box indicating the DC array with its rated voltage and capacity. At utility scale, the array is typically shown as multiple strings feeding into combiner boxes.
- Battery/BESS: Represented by the standard battery symbol (parallel lines of alternating lengths) or by a labelled box indicating the battery system with its rated energy (MWh) and power (MW) capacity.
- Generator/Synchronous Machine: A circle with a sine wave or "G" label inside, typically with voltage and MVA rating shown alongside.
- Wind Turbine: A circle with a propeller symbol, or a labelled box for the wind turbine generator.
Transformers
Transformers are among the most important and most frequently misread components in an SLD. They are represented by two circles (for two-winding transformers) or three circles (for three-winding) placed adjacent to each other, with a line indicating the magnetic coupling between windings.
Alongside the transformer symbol, key data that must always appear includes:
- Primary voltage (e.g., 132 kV)
- Secondary voltage (e.g., 11 kV)
- Rated capacity (e.g., 50 MVA)
- Impedance percentage (e.g., Z = 12.5%)
- Vector group (e.g., Dyn11)
- Cooling type (e.g., ONAN)
The vector group tells you the phase shift between primary and secondary windings. The impedance percentage is essential for fault level calculations. Neither should be omitted from a complete SLD.
Switchgear and Circuit Breakers
Switchgear symbols represent devices that interrupt current, either for normal switching operations or under fault conditions.
- Circuit Breaker: A cross or X within a square box, or a specific IEC symbol depending on the drawing convention. Circuit breakers should be labelled with their equipment tag, rated current, rated voltage, and interrupting capacity.
- Disconnector/Isolator: A line with a gap and contact points, indicating a device that provides visible isolation but is not rated for fault interruption. Isolators are used in conjunction with circuit breakers, never as standalone switching devices under load.
- Fuse: Shown as a rectangle around the line conductor, indicating a fusible element. Fuses are more common in LV systems and in older MV installations.
- Load Break Switch: A switch symbol with specific markings indicating it can interrupt load current (but not fault current). Common in MV ring main units.
Busbars
Diagrams start at the top of the page with the incoming source of a system's power. Electrical symbols are typically fed from the top and feed from the bottom.
Busbars are drawn as thick horizontal or vertical lines that act as common connection points. Multiple circuits connect to the same busbar and share its voltage. Key busbar information shown on an SLD includes:
- Busbar voltage
- Busbar fault level
Current Transformers and Voltage Transformers
Current transformers (CTs) and voltage transformers (VTs) are the metering and protection instruments that sense electrical quantities and feed them to protection relays, energy meters, and monitoring systems. They appear on SLDs as specific IEC symbols and must include their ratio and accuracy class.
- CT Symbol: A circle around the single line, with a secondary terminal shown below. The CT ratio and accuracy class are annotated alongside.
- VT Symbol: A small transformer symbol connected between the line and earth or between two lines, with secondary ratio annotated.
On protection-critical circuits, CTs and VTs appear at every point where a protection relay or energy meter needs an electrical measurement input. Missing CT or VT data on an SLD is a common gap that creates problems during protection system design.
Protection Relays
Protection relays are shown as diamond or rectangle symbols on an SLD, connected to their associated CT or VT inputs and to the tripping output of the associated circuit breaker.
Relay symbols include an ANSI function number that identifies the protection function:
- ANSI 50/51: Overcurrent and time overcurrent protection
- ANSI 27: Undervoltage protection
- ANSI 59: Overvoltage protection
- ANSI 67: Directional overcurrent
- ANSI 87: Differential protection (transformer, busbar, feeder)
- ANSI 21: Distance/impedance protection
- ANSI 81U/81O: Under/overfrequency protection
- ANSI 81R: Rate of change of frequency (ROCOF)
- ANSI 32: Directional power (reverse power)
For Australian solar and BESS projects, functions 27, 59, 81U, 81O, 81R, and 32 are the minimum interface protection requirements under AS/NZS 4777.1:2025, and they must appear on the SLD to demonstrate compliance.
Inverters
Inverters are shown as labelled boxes (typically with a DC/AC arrow or the inverter symbol from IEC 60617) with their rated AC output power, AC voltage, DC input voltage range, and connection point annotated.
At utility scale, multiple inverter stations are shown individually on the MV collection section of the SLD, connected to their associated step-up transformer and the MV collection busbar.
Metering and Revenue Metering
Revenue metering equipment appears on the SLD as a metering point symbol, typically at the connection point between the project and the network. The metering point on a utility-scale solar SLD must comply with the National Electricity Rules metering provisions and must be shown in the correct location relative to the grid connection point.
How to Read a Single Line Diagram
Reading a complex SLD for the first time can be overwhelming. Following a structured approach makes it manageable and ensures nothing is missed.
Identify the Highest Voltage Point and Work Down
When interpreting a single line diagram, you should always start at the top where the highest voltage is and work your way down to the lowest voltage. This helps to keep the voltages and their paths straight.
For a utility-scale solar farm, the highest voltage point is typically the grid connection. For a commercial building, it may be the 11 kV distribution supply or the 230/400 V LV switchboard. Starting at the highest voltage point gives you the context for every other voltage level.
Trace the Power Flow Path
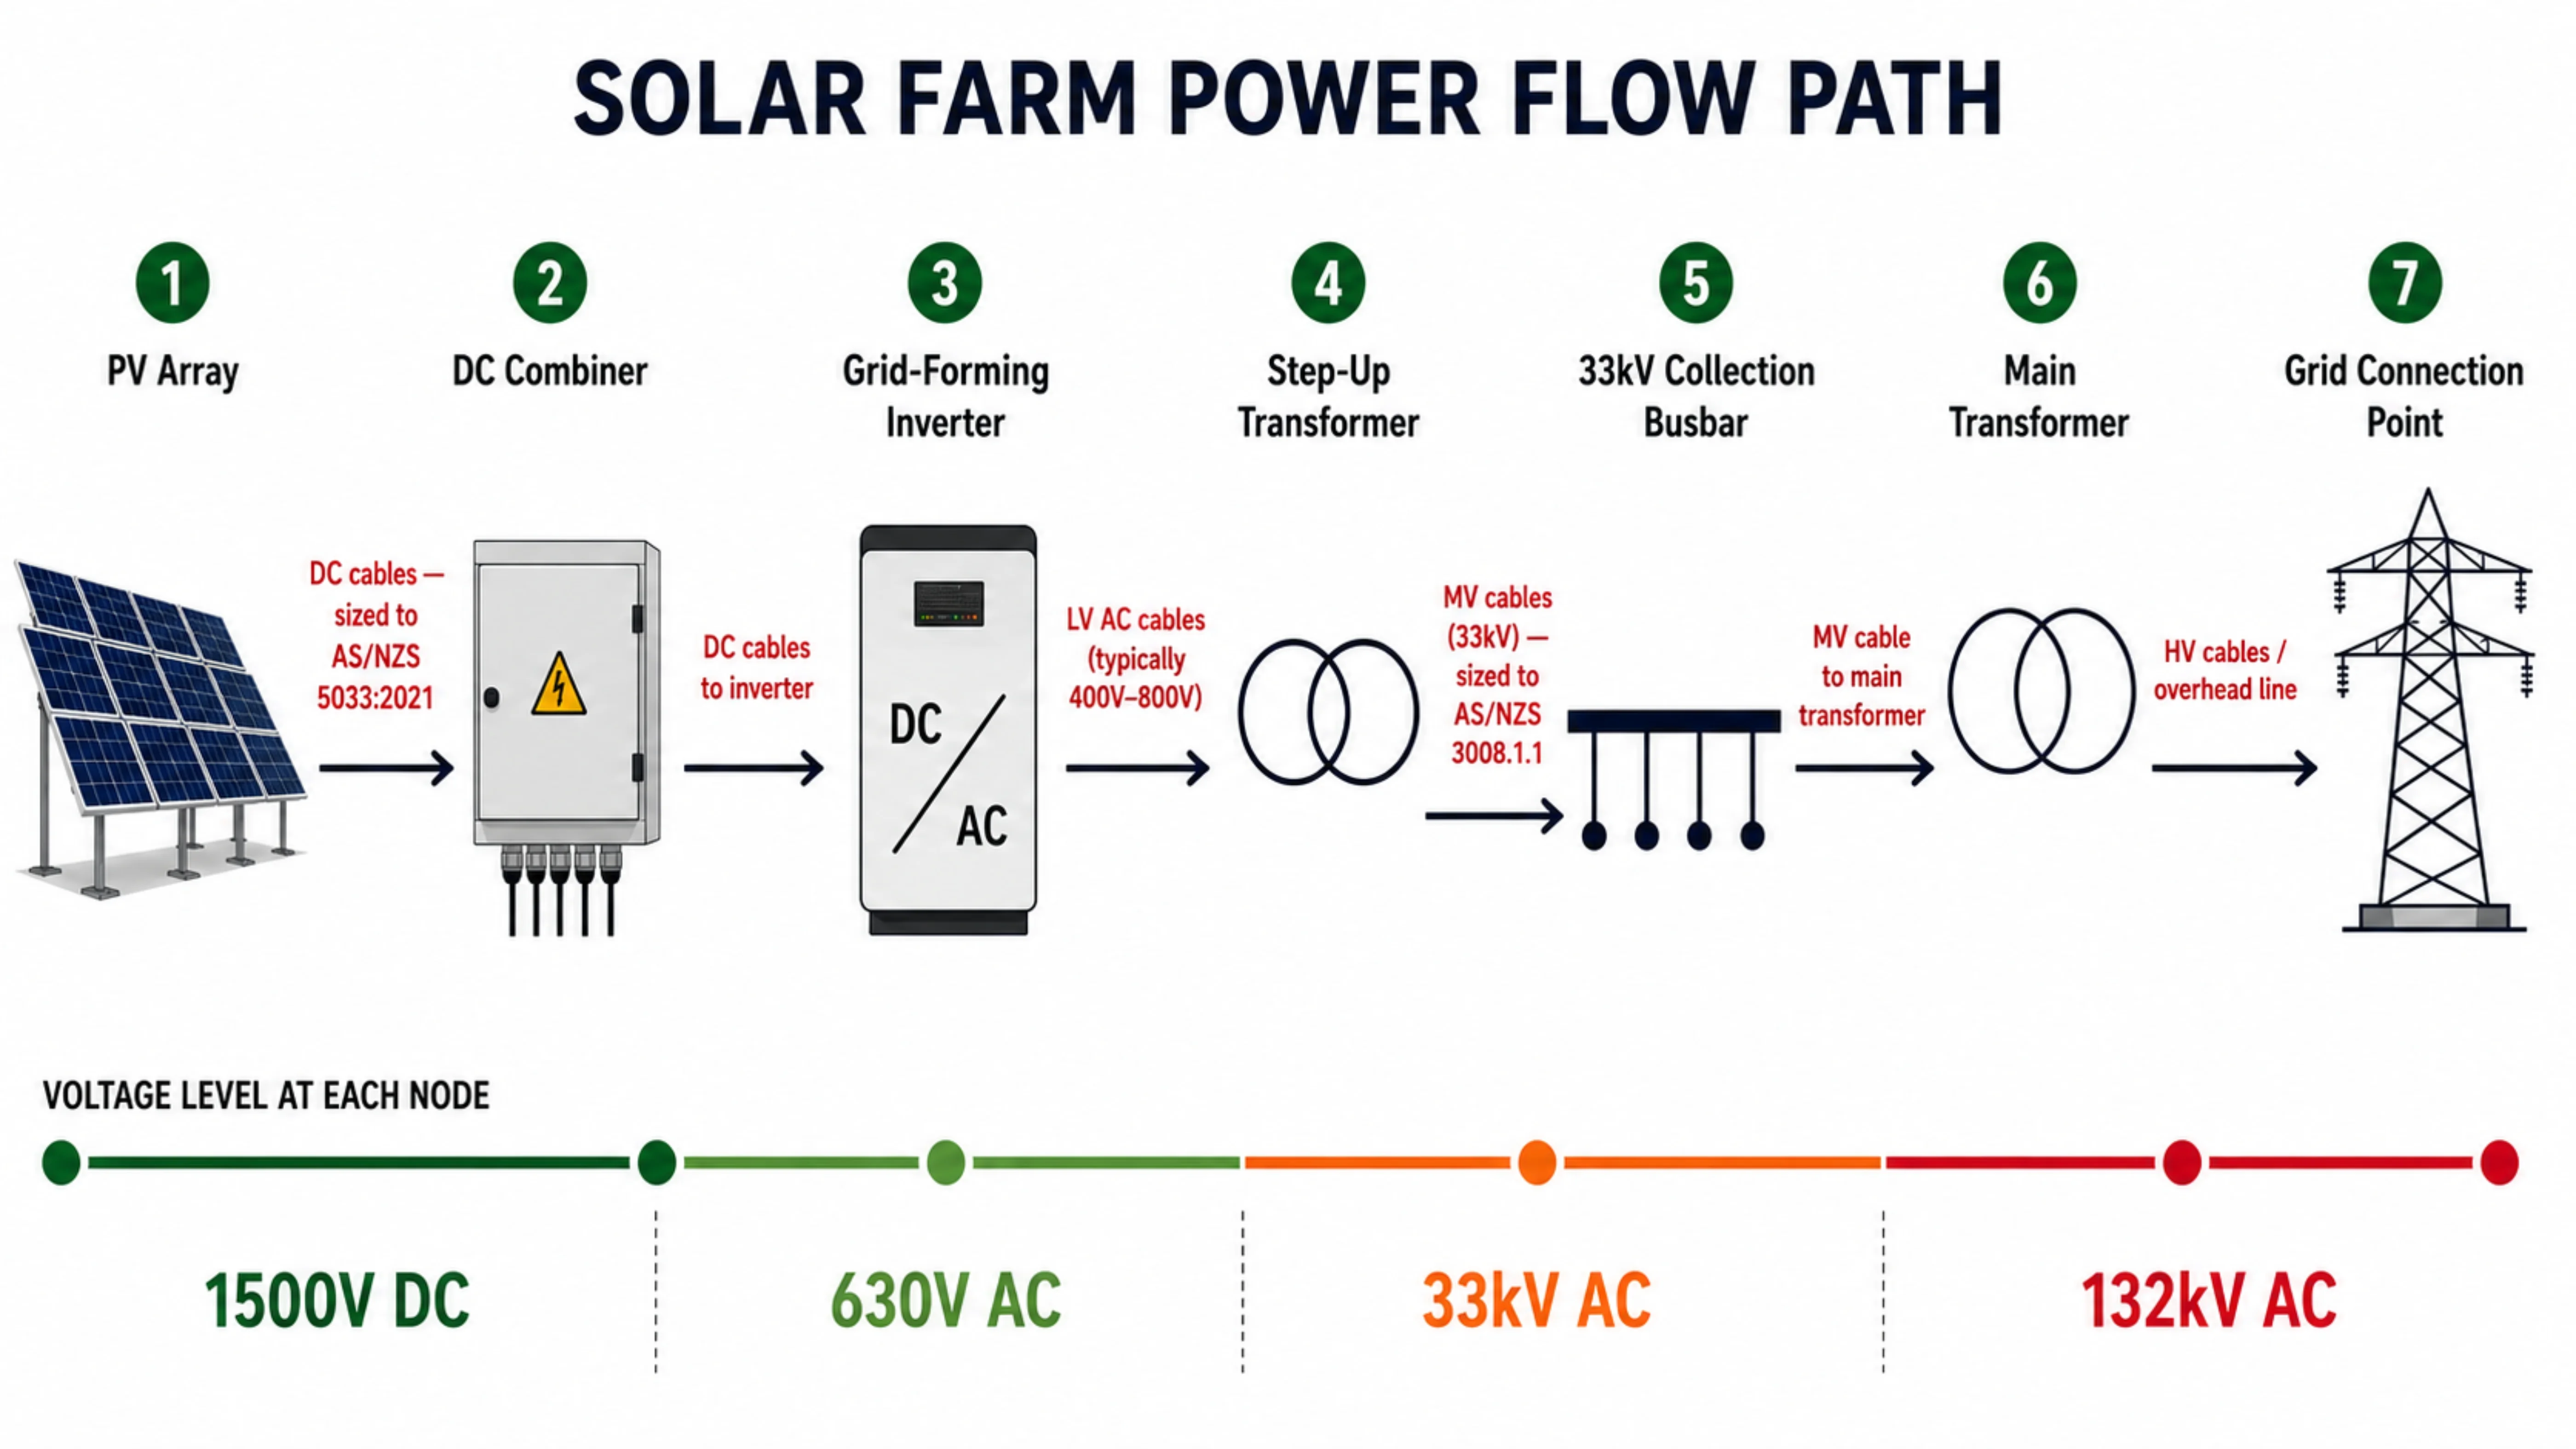
Most diagrams are arranged so that power flows from the top down or from left to right. By tracing this path, readers can understand how electrical energy moves between equipment and ultimately reaches the end users.
For a utility-scale solar farm, the power flow path typically runs:
- DC Source: PV arrays → string combiner boxes
- DC/AC Conversion: Combiner boxes → inverters (DC to AC)
- Voltage Step-Up: Inverter AC output → inverter step-up transformer (LV to MV)
- MV Collection: Step-up transformer → MV collection busbar
- Main Step-Up: MV collection busbar → main power transformer (MV to HV)
- Grid Connection: Main transformer HV winding → HV switchgear → grid
Identify All Voltage Levels
Note every transformer and the voltage transformation it provides. A well-drawn SLD annotates the voltage level at every major node. These voltage annotations tell you which standards and equipment ratings apply at each part of the system.
Identify All Protection and Switching Devices
Work through each circuit breaker, disconnector, relay, CT, and VT in the diagram. For each protection relay, note the ANSI function numbers to understand what the relay is protecting.
Check that protection coverage is complete. every circuit that can carry fault current should have overcurrent protection, and every transformer should have differential protection at higher voltage levels.
Read the Equipment Tags
There is no physical location or size represented of the electrical equipment. Equipment tags are how you cross-reference the SLD to other documents. Every major component on an SLD carries a unique tag:
- TR-001: Transformer 001
- CB-101: Circuit breaker 101
- INV-01: Inverter station 01
- SWB-01: Switchboard 01
- MET-01: Metering point 01
These tags link the SLD to the equipment schedule, protection relay settings, cable schedule, and test records. An SLD without consistent equipment tagging is not a complete engineering document.
Check the Drawing Metadata
Before acting on any SLD, verify:
- Revision Status: Is this the current approved revision? An outdated SLD may not reflect actual installed conditions.
- Approval Status: Has this reached IFC or As-Built status?
- Drawing Legend: Confirm symbol meanings against the legend. Do not assume symbols are consistent across different organisations or project standards.
- Standards Reference: Which standards govern this drawing?
What Single Line Diagrams Are for Specific Project Types in Australia?
Solar PV Projects
Utility-scale solar parks have very large SLDs spanning arrays of solar panels, central inverters or inverter stations, MV collection networks, and grid substations. These SLDs are living documents updated throughout the plant's operational life.
The SLD for a utility-scale solar farm in Australia must show:
- DC collection system: string combiner boxes, DC cable ratings, array capacity per combiner
- Inverter stations: each inverter's rated capacity, DC input, AC output, and interface protection functions
- Inverter step-up transformers: voltage ratio, MVA rating, impedance, vector group
- MV collection network: feeder configuration (radial or ring), cable ratings, protection
- Main power transformer: voltage ratio, MVA rating, impedance, vector group
- HV switchyard: circuit breakers, disconnectors, instrument transformers, protection relays
- Grid connection: SCADA interface, revenue metering, protection relay ANSI functions for AEMO GPS compliance
Battery Energy Storage Systems
BESS SLDs must show the complete power conversion architecture:
- Battery modules and their DC bus voltage
- Battery Management System (BMS) connections to the Power Conversion System
- PCS (inverter/converter): DC input ratings, AC output ratings
- AC transformer: LV to MV step-up, with ratings
- AC connection to the grid or to the co-located solar farm AC collector
- Protection coordination: overcurrent, undervoltage, overfrequency protection must all appear
For BESS projects connecting to the NEM, the interface protection functions required by AEMO GPS must be explicitly shown on the SLD with their ANSI function codes.
Commercial and Industrial Buildings
In commercial and industrial installations, the SLD shows:
- Utility supply connection: metering, main switch, service protective device
- Main switchboard (MSB): busbars, main circuit breaker, sub-feeder circuit breakers
- Distribution boards (DBs): sub-feeder connection, outgoing circuits
- Major loads: motors, HVAC equipment, lifts, data centre UPS systems, EV charger infrastructure
- Emergency systems: generator, automatic transfer switch (ATS), essential services board
In Australia, the SLD for a commercial building must be consistent with AS/NZS 3000, and the maximum demand calculation that determines the main switchboard rating should be documented alongside or referenced from the SLD.
How Are Single Line Diagrams Connected to Cable Sizing?
An SLD and a cable sizing calculation are not independent documents. Every cable shown on the SLD must be sized based on three checks under AS/NZS 3000 and AS/NZS 3008.1.1:
- Current-Carrying Capacity: The cable must carry the design current after all derating factors for ambient temperature, grouping, and installation conditions
- Voltage Drop: The cumulative voltage drop from the main switchboard to the load must not exceed 5% of nominal voltage under AS/NZS 3000 Clause 3.6
- Fault Loop Impedance: The total fault loop impedance (Zs) must be below the maximum permitted value for the protective device, ensuring disconnection within 0.4 seconds or 5 seconds
The SLD defines the circuit topology,which circuit breaker protects which cable, and what load the cable serves. Without an accurate SLD, cable sizing cannot be done correctly. Without correct cable sizing, the system shown on the SLD will not perform as designed.
This connection runs in the other direction too: when cable sizing reveals that a protective device or cable size needs to change, the SLD must be updated to reflect the revised design. SLD and cable schedule are co-dependent documents throughout the design process.
Design Your Single Line Diagram with CableHero
Understanding how to read a single line diagram is the first step. Being able to produce one is what engineers actually need on live projects.
CableHero is a cable sizing software built for Australian electricians and engineers, fully aligned with AS/NZS 3000:2018 and AS/NZS 3008. CableHero enables you to create Single Line Diagrams within the same workflow as your cable sizing calculations, so your SLD and your cable schedule are always consistent with each other, from the first design revision to the final IFC set.
Whether you're designing a residential fit-out, a commercial building, or a utility-scale solar installation, CableHero gives you the tools to produce accurate, compliant SLDs and cable documentation in the same place.
FAQ
What is the difference between a single line diagram and a schematic diagram?
A single line diagram (SLD) is a high-level schematic representation of an electrical power system, using a single line to represent three-phase circuits and standardised symbols to show major equipment and their interconnections. A schematic diagram shows the detailed electrical connections of a specific system or piece of equipment, individual conductors, relay contacts, terminal numbers, and cable references.
Which symbol standard is used for single line diagrams in Australia?
In Australia, single line diagrams use symbols defined by IEC 60617, the International Electrotechnical Commission's international standard for electrical diagram symbols.
How does a single line diagram relate to cable sizing under AS/NZS 3000?
A single line diagram defines the electrical circuit topology that cable sizing calculations depend on. Every connection shown on the SLD represents one or more cables that must be sized under the three-check method required by AS/NZS 3000 and AS/NZS 3008.1.1: current-carrying capacity, voltage drop, and fault loop impedance
Tags:cable-sizingsingle-line-diagramas-nzs-3000as-nzs-3008solartutorial
Related Articles
Continue reading more articles on this topic.
 Industry Knowledge
Ahmed Tayeh 13 Oct 2026
Single Line Diagram for Commercial Buildings: A Step-by-Step Guide
A single line diagram is the backbone of every commercial electrical design, sho…
Read More → Industry Knowledge
Ahmed Tayeh 30 June 2026
Top 10 Cable Sizing Mistakes and How to Avoid Them
Cable sizing looks easy until you look closer. Here are common cable sizing mist…
Read More → Cable Sizing
Ahmed Tayeh 19 June 2025
Fault Current and Cable Sizing: What Every Electrician Should Know
As an electrician or engineer, selecting the right cable for your installation g…
Read More →